colors = ["C0", "C1", "C2"]
for (label, accuracy), color in zip(accuracy_curves.items(), colors):
ax.plot(training_steps, accuracy, label=label, color=color)Point.
Speak.
Perfect your plot.
Edit plots in your VS Code notebooks
by pointing and speaking.
7-day free trial · then $1.99/month
simple_plots.ipynbPython
[1]
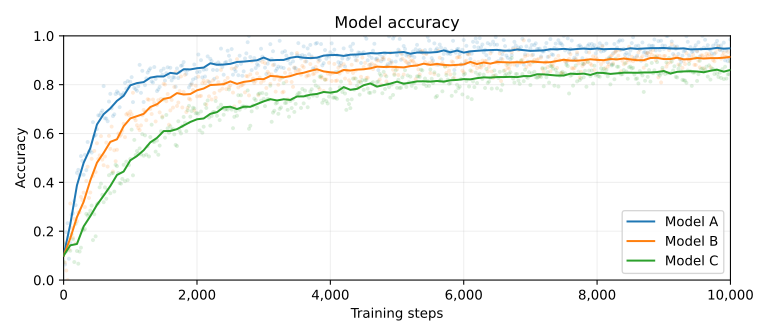
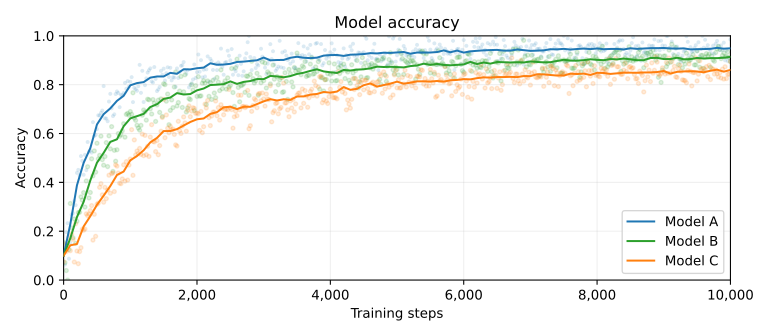
 ▂ ▅ ▇ ▃ ▆ ▂Swap the color of these two curves.space
Point and speak. The code follows.
Same notebook. Updated Python.
LESS TWEAKING. MORE THINKING.
Your next plot,
a conversation away.
Better figures. Still your Python.